
Authors:
(1) Toshit Jain, Indian Institute of Science Bangalore, India;
(2) Varun Singh, Indian Institute of Science Bangalore, India;
(3) Vijay Kumar Boda, Indian Institute of Science Bangalore, India;
(4) Upkar Singh, Indian Institute of Science Bangalore, India;
(5) Ingrid Hotz, Indian Institute of Science Bangalore, India and Department of Science and Technology (ITN), Linköping University, Norrköping, Sweden;
(6) P. N. Vinayachandran, Indian Institute of Science Bangalore, India;
(7) Vijay Natarajan, Indian Institute of Science Bangalore, India.
Table of Links
- Abstract and Intro
- Ocean data
- pyParaOcean: Architecture
- pyParaOcean: Functionalities
- Case study: Bay of Bengal
- Conclusion
- Acknowledgments and References
3. pyParaOcean: Architecture
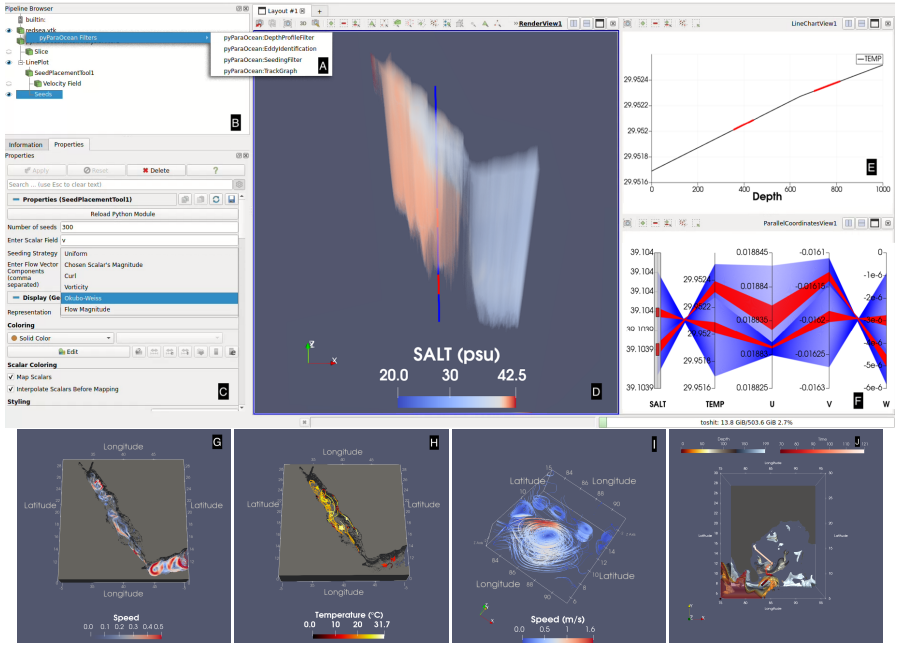
pyParaOcean is a plugin developed on top of Paraview to cater to the visualization needs of oceanographers, see Figure 1. Paraview [AGL05] is an open source visualization software. The visualization pipeline in Paraview is a data flow network of executable modules. A module is a functional unit in Paraview with zero or more input ports and zero or more output ports. A module in Paraview can perform one of three tasks: produce data (source), handle and process incoming data (filter), or render/produce image (sink). Paraview is a general purpose visualization tool and hence includes
a large number of readers, data sources, and filters. The sheer number of available filters tends to get overwhelming and arduous to navigate, particularly for an application domain expert. Paraview also provides a mechanism for including new modules via plugins in scenarios where the available collection of modules does not meet the needs of the user.
he plugin is a collection of filters that provide visualization tools for interactive analysis of 3D ocean data and specialized features such as eddy computation and visualization, high salinity water visualization, and tracking of high salinity water masses. Ocean data is typically available as samples on a rectilinear grid in the NetCDF format. The plugin uses built-in VTK and Paraview libraries when appropriate, which are well maintained and supported, and hence benefits from the availability of support from the user community. The plugin can be loaded in a few simple steps.
Paraview is designed as a three-tier client-server architecture, consisting of a data server, a render server, and the client. The data server is responsible for all data related tasks such as reading, writing, and filtering. The render server is responsible for rendering and the interaction and exploration is performed at the client. The client manages the creation, execution, and destruction of objects on the servers, but it does not contain the data. This architecture is useful for running applications in a parallel environment. The data and render server can be run on a headless server or a supercomputer while the device with the end user acts as a client. When executed on the client without any connection to a remote server, Paraview seamlessly connects to a built-in server and provides all of its functionality. pyParaOcean is designed to leverage the parallelization capabilities of Paraview, to scale with larger data sizes. pyParaOcean aims to provide a set of filters specific to the needs of an oceanographer that is extensive, accessible, and easy-to-use.
This paper is available on arxiv under CC 4.0 license.